The rules for search engine optimization have changed. It’s no longer about individual keywords and page rank – experts tell us it’s about topics and the “long tail”. But if position and individual terms aren’t the focus, how do you know if changes you made have any impact? This free Excel report demonstrates a new way to gain insight.
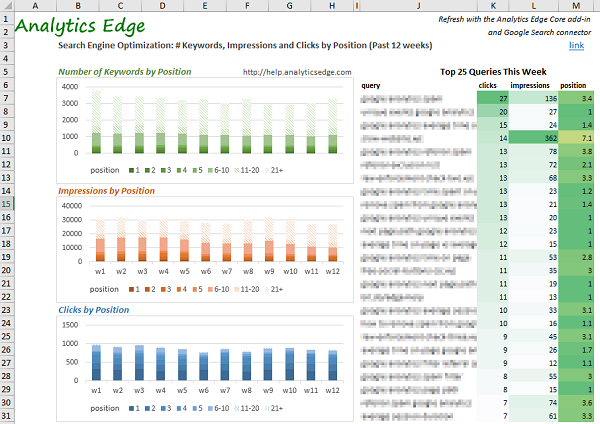
It’s no longer about which individual keyword, phrase or query was ranked specifically how high, but a more holistic view of how many times your pages appeared in the top search results, how many and what queries brought you there. For example, in the image above, you can see the number of keywords by position for each of the past 12 weeks, as well as the impressions and clicks for each position.
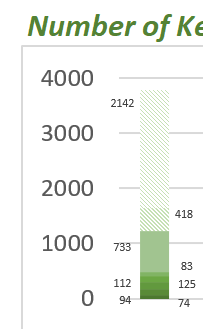 The first chart in the report provides a good visualization of how many different queries showed your content at position 1, 2, 3, etc. For example:
- 74 different query phrases showed my content at position 1 (dark green portion at the bottom of the chart)
- 94 at position 2
- 125 at position 3
- and so on.
The whole bar represents over 3700 different keyword combinations, with the darker portions indicating better positions.
From a search optimization perspective, there are almost 490 different queries that delivered a top-5 position. The other two charts show the number of impressions and clicks that those keywords delivered.
The listing at the right of the report provides a sampling of the top 25 queries that resulted in clicks in the past week. A quick scan down the list of queries will reveal the themes or topics that are popular. You may see some some opportunities to optimize some content, where the position is not so good, yet the impressions are high.
Made Possible With the Analytics Edge Core Add-in
The report can be created manually in Excel – none of the steps are hard to perform:
- grab 12 week’s worth of data
- remove queries that include branded terms
- count the number of different keywords (rows) for each position
- total the clicks and impressions for each position
- rearrange the data as needed for the charts
The Analytics Edge Core Add-in can automate all of these steps without programming or complicated formulas, allowing you to build the report in minutes and refresh it in seconds. See it in action: build a Quick SEO Report in Excel.
You Don’t Have To Figure It All Out
If all of this seems just too much to figure out by yourself, just drop me an email (mike@analyticsedge.com). I am always looking for ways to demonstrate the capabilities of Analytics Edge, and it takes so little time, I usually do it for free.