Way back in the 1970’s, the concept of ‘extract, transform and load’ (ETL) became popular in data warehousing environments. ETL tools could grab data from multiple sources, combine and transform it through various operations, then load it into database tables. In 2013, Analytics Edge brought that same capability to Microsoft Excel in the form of its Core Add-in and connectors. This article discusses ETL and how Excel and Analytics Edge products can be used to transform your data for more insightful analysis.
Extract, Transform and Load: The Basics
The Analytics Edge add-in makes it possible to Extract your data from various services like Google Analytics through a selection of connectors. It also makes it easy to Load that data into your Excel spreadsheets, automating the process of downloading and importing your data. Behind the scenes, the connectors also Transform the data from the XML, JSON or CSV formatted data that the service API provides, into a simple table of data that you see in Excel.
{“reports”:[{“data”:{“rows”:[{“dimensions”:[“help.analyticsedge.com”,”/article/mis…”,”google / organic”],”metrics”:[{“values”:[“1245″,”1150″,”399.0298″,”1129″,”87.3339″,”86.506″,”0.0”]}]}…

This type of transformation doesn’t really add much value other than to give you the data you asked for, in the format you wanted. ETL at its very basic level.
Data Extract Ideas:
- segment your data by adding a dimension to your report (like adding the Source/Medium to a Pages report). Using more than one dimension makes it possible to understand what is really driving your traffic, goals or revenue.
- always try to provide context by showing an unfiltered total number beside any filtered metrics. The most common source of traffic to the least popular page is not headline news.
- compare numbers to the previous period for extra context; “bad and getting worse” is a very different message from just “bad”.
- try to show metrics that will provoke action. Numbers that have no purpose create reports that no one reads. This means reports should change regularly — they should evolve with the questions stakeholders ask.
Simple Transformations
That simple listing of data may be all you want for many of your reports, but there are times when you find yourself ‘playing with the data’ to look for something that isn’t immediately obvious. These additional transformations usually involve sorting, filtering and arranging the data differently, and may even require the use of a pivot table. While Excel has established itself as a great tool for ‘playing with the data’, trying to automate a few simple steps can be time consuming and error-prone (this is what the phrase “spreadsheet hell” describes).
This is where the Analytics Edge Core Add-in steps up to the plate with quick query functions like pivot, filter, sort and arrange. It allows you to get all that done before the data goes into Excel: Extract, Transform, then Load.
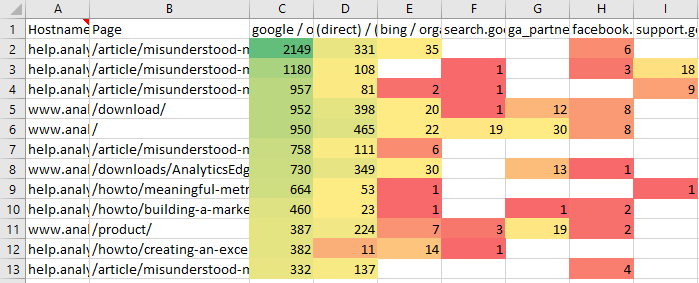
The pivot command is especially powerful, allowing you to see trends or explore the relationship between two parameters, such as which pages are most popular by source (as in the image above). Pivoted data usually needs to be sorted differently, filtered to remove noise and junk data, and arranged to show the important things first.
While Excel’s PivotTable can do all of this, many people find it overly complicated as Microsoft has added feature upon feature upon feature over the years (since 1994!). There is a lot of capability there…if you can find it. The Analytics Edge Core Add-in provides a simplified Pivot function along with Arrange, Sort and Filter options in a pop-up Functions wizard just before you write your data to your worksheet. A powerful capability available just when you need it.
With these simple transformations, either manually in Excel or by using the features of the Core Add-in, there are many new analysis possibilities for your extracted data.
Data Transformation Ideas:
- sort each numeric column to see what rows pop to the top. Pages/sources with the highest bounce rate? The highest exit rate? Everyone looks at the top 10, but what about the bottom 10 (sorted the other way around)? The lowest exit rate pages are the ‘stickiest’.
- filter out your high and low volume pages/sources/products so you can explore the middle-80% of your data. In most cases, this is where things change the most, and early warning signs are often overlooked.
- pivot by device category, browser or operating system to make sure your platform support doesn’t have a serious flaw. Pivot by country or language on international sites.
- trend everything…sudden changes in any metric needs investigating. Do NOT include these boring trend lines in regular reports to stakeholders; only show them if and when you see a significant change.
Stepping Up Your Game
Most people stop with simple transformations of available data — we humans work with what we have readily available. Simple data, simple tools, simple results. No one goes searching for a more complicated life…unless you have to. When you do need more than a simple pivot or filter, the world of transformation possibilities is endless and each path is unique. Both Microsoft Excel and the Analytics Edge Core Add-in were designed to empower your data manipulation without arbitrary restrictions. You can choose your own path — this is what brings many people to Excel in the first place.
With Excel, you can manually transform the data you have into something totally different — combining duplicates, performing lookups, adding calculated columns, splitting columns, or comparing two sets of data. Step-by-step you modify the data into something completely different in your search for a nugget of insight from the data. This kind of analysis can sometimes lead to eureka moments — where something becomes obvious in the data that was hidden before. If you do see something that warrants a change to your business, then prepare to repeat those steps on a regular basis until you can show things are back on track. Specific analysis reports like these have a life span, so you don’t want to invest too much time in them.
That is where the Analytics Edge Core Add-in comes in; the Add-in includes many transformation functions, like combining duplicates, performing lookups, adding calculated columns, splitting columns, or comparing two sets of data (sound familiar?). As you step-by-step modify your data, it records the steps into a ‘macro’ that can be replayed instantly. Using simple function wizards, you don’t waste any time looking up formula syntax or trying to remember how the Visual Basic editor works, and your analysis is done faster. A lot faster. Changes are just as fast, and that is important because we all know that our analysis evolves as we work with the data. Because your steps are recorded and can be replayed and edited, you can easily go back to the beginning and add a step — not something you want to do in a manual process.

But what can you do? Lots of things…if you can think of them. That is usually where people get stuck: we don’t know what we don’t know. This is why most people are happy with ‘canned’ reports. Someone else thought them up, but we can benefit from them. No thinking required; we work with what we have.
A Sampling of Possibilities
With Analytics Edge, I have posted a lot of free reports and how-to articles exploring the capabilities of the tools. Like a Branded vs Non-Branded Search Report, or a Search Position Distribution Report (shown below). I even played with the fringe of Excel’s presentation capabilities with an Interactive Behavior Flow as well as recreating the standard Audience Overview report.
You should have a close look at the whole collection of free reports and how-to articles to see some of the possibilities for yourself.

Don’t feel limited by what you see — I have also helped many customers build reports specific to their businesses, and while I can’t share the details, I freely provide guidance when asked. If you see something and get a spark of an idea, reach out and ask what is possible.
mike_sullivan@analyticsedge.com